I've written something about processes Let's write some notes about threads. This is not really an introduction to threads. It's more like a little bit of introspection, so we can have an interesting perspective of what are threads.
What's really a thread?
Processes each have their own address space. Threads exist as subsets of a process. Threads are just multiple workers in the same virtual address space all threads in a process share the same memory. They can also share open files and other resources. Within that VAS, each thread has its own ID, its own stack, its own program counter, its own independent flow of control, its own registers set. A thread is just a context of execution.
Image from mooneegee.blogspot.sn
Next is a c script spawning two posix threads:
#define _GNU_SOURCE
#include <stdio.h>
#include <stdlib.h>
#include <pthread.h>
#include <unistd.h> // sleep
#include <sys/syscall.h>
#include <sys/types.h>

void * say_hello(void* data){
  char *str = (char*)data;
  int howmany = 4;
  int r = (rand() % 20);
  pid_t thread_id = syscall(__NR_gettid);

  while(howmany > 0){
    sleep(r);
    howmany = howmany - 1;

    printf("%s, ",str);
    printf("from thread %u and process %u\n",
           thread_id, getpid());
  }
  return NULL;
}

int main(void){
  pthread_t t1,t2;

  if (getpid() < 0) {
    perror("unable to get pid");
  } else {
    printf("The main process id is %d\n", getpid());
  }

  pthread_create(&t1,NULL,say_hello,"howdy");
  pthread_create(&t2,NULL,say_hello,"hello");
  pthread_join(t1,NULL);
  pthread_join(t2,NULL);
  return 0;
}
If we strace the execution of our c script:
$ strace -f ./bin/how_to_thread
The output will display lots of informations. And for what we are doing, the most interesting lines will look like this:
clone(child_stack=0x7f30fa9b8ff0, flags=CLONE_VM|CLONE_FS|CLONE_FILES|CLONE_SIGHAND|CLONE_THREAD|CLONE_SYSVSEM|CLONE_SETTLS|CLONE_PARENT_SETTID|CLONE_CHILD_CLEARTID, parent_tidptr=0x7f30fa9b99d0, tls=0x7f30fa9b9700, child_tidptr=0x7f30fa9b99d0) = 7450
Process 7450 attached
[pid  7449] clone(child_stack=0x7f30fa1b7ff0, flags=CLONE_VM|CLONE_FS|CLONE_FILES|CLONE_SIGHAND|CLONE_THREAD|CLONE_SYSVSEM|CLONE_SETTLS|CLONE_PARENT_SETTID|CLONE_CHILD_CLEARTID, parent_tidptr=0x7f30fa1b89d0, tls=0x7f30fa1b8700, child_tidptr=0x7f30fa1b89d0) = 7451
The clone() system call:
Processes are created with the fork() system call. However, there is a separate system call, named clone() which is used for creating threads. It works like fork(), but it accepts a number of flags for adjusting its behavior so the child can share some parts of the parent's execution context. Our c script made a call to clone() twice. And looking at some of the flags that have been passed, we can see that:
the caller and the child process:
- CLONE_VM: run in the same memory space.
- CLONE_FS: share the same filesystem information.
- CLONE_FILES: share the same file descriptor table.
- CLONE_THREAD: are placed in the same thread group.
Another interesting arguments passed to clone system call are child_stack and tls. From the man page, we can read somewhere:
The child_stack argument specifies the location of the stack used by the child process.
And in another part of the man page:
set a thread local storage (TLS) area
Basically, we're allocating a personal stack to each of our threads. But, we also give each thread, an access to a region of memory which is not shared with all other threads. Like one may do with Python using the threading.local class.
GDB to the rescue
Let's have a confirmation using GDB:
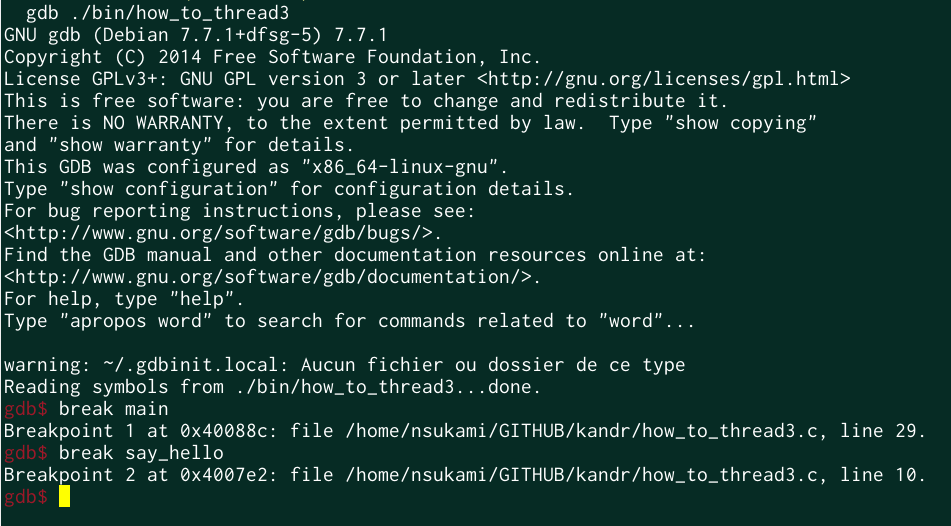
$ gdb ./bin/how_to_thread
First, we set two breakpoints, one at the start of the main function, another one at the start of the say_hello function:
Then we start the debugged program: r, and list the mapped memory regions:
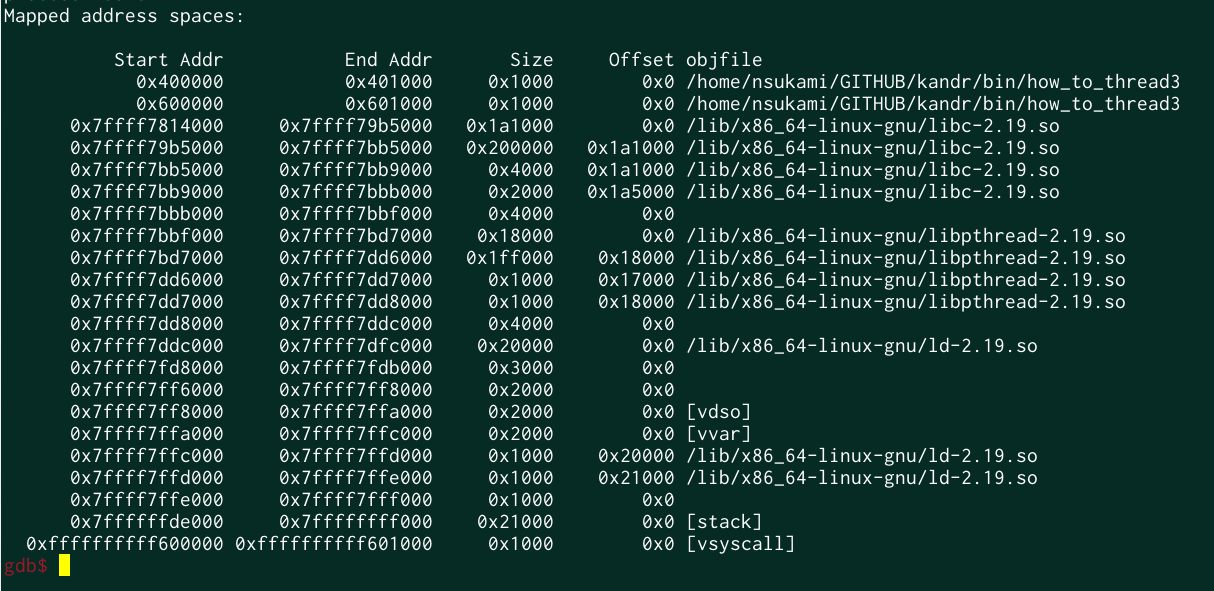
So far, we see only one stack segment, the one used by the main process, that is because our threads are not yet created. Let's continue a little bit (twice) with c, and you should be able to see something like this:
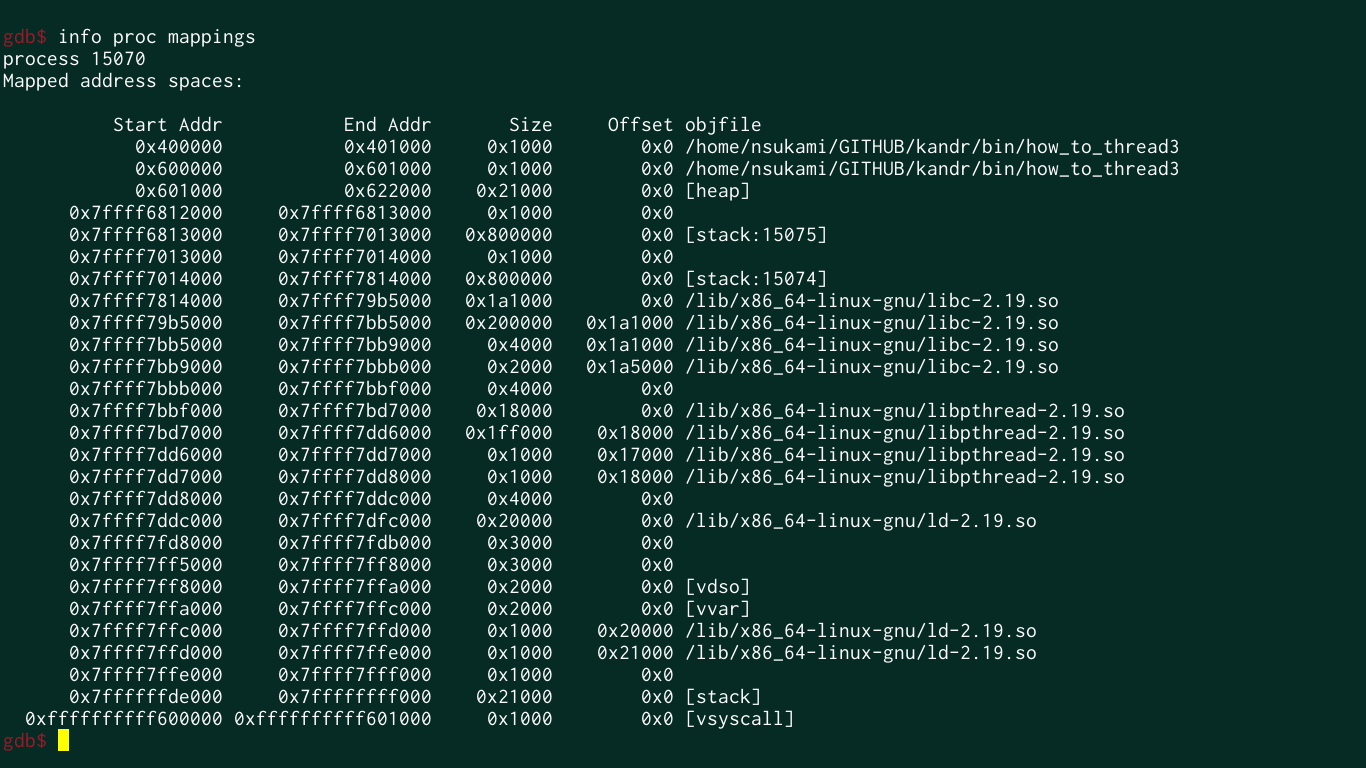
This time, we can see three stacks in the same virtual address space. The ones used by our threads are [stack:15074] and [stack:15075]. GDB to inspect each thread's stack:
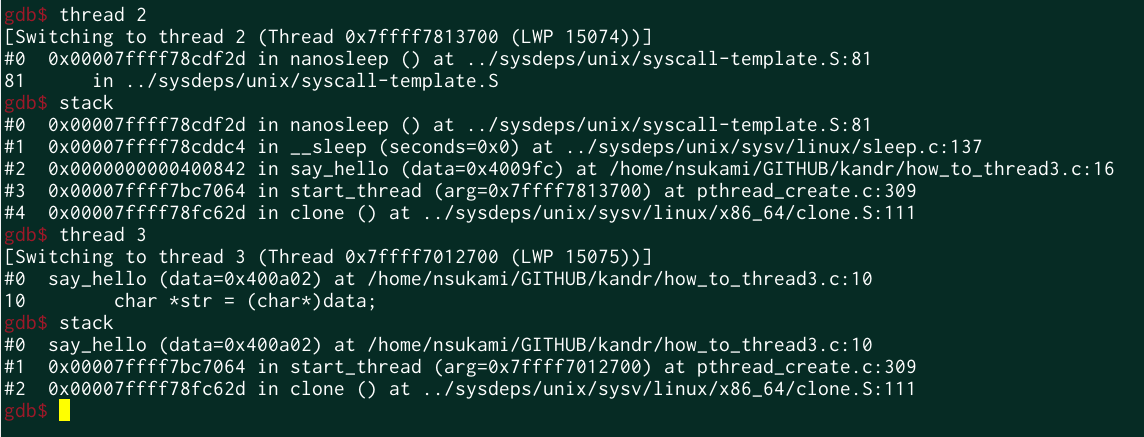
LWP is an acronym and stands for Light Weight Process. Next to LWP is the thread ID assigned by the kernel to this thread. We see that each thread has its own stack, and inside each stack, the progress is different, while thread 3 is entering the say_hello function, thread 2 is in nanosleep. By the way nanosleep is also a system call.
Here we are, a thread is indeed just a context of execution.
I won't be able to cover the whole topic as it's not an easy and small one. So you may find really interesting the following links: