As a Debian user, I often want to see the active processes, sometimes, I want to kill them. I know how to launch a new process, inside my Python scripts. But what is a process?
A process is the execution context of a running program. When an executable program is read into memory by the kernel and executed, it becomes a process. Processes are dynamic entities, they are constantly changing as their machine code instructions are executed by the CPU.
With the exception of the init process, every process is the child of another process. And every process has the potential to be the parent of another process. The following is a small C program that will print the current process ID and the corresponding parent process ID:
#include <stdio.h>
#include <unistd.h>

int main (){
  char ch;
  printf ("The process ID is %d\n", (int) getpid ());
  printf ("The parent process ID is %d\n", (int) getppid ());
  while ( ch != '\r' && ch != '\n' ){
    ch = getchar();
  }
  return 0;
}
After execution, you should see something like:
~
+-> ./bin/ex1
The process ID is 11147
The parent process ID is 9552
Virtual address space?
A virtual address space, VAS, is the set of ranges of virtual addresses available to a process. The virtual address space is what a process sees when it executes. A process works with and only sees VAS. The operating system handles mapping VAS to real storage so that this is invisible to the running program.
We need VAS to prevent process A and process B from writing/reading in the same memory addresses. VAS is a way to achieve process isolation. With VAS, several programs could write to memory location at the same address without stepping over each others results.
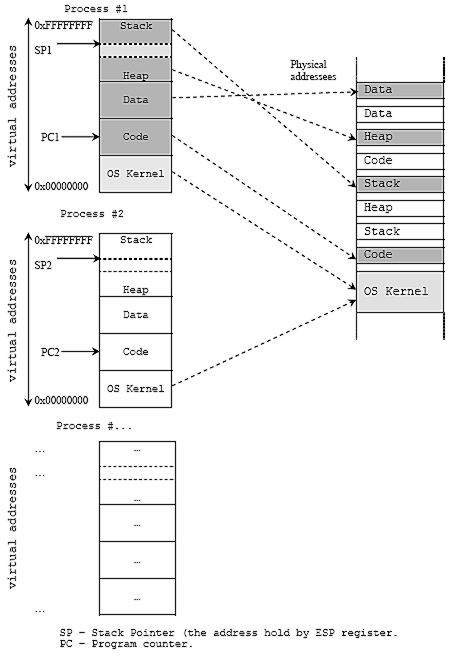
Image from tenouk.com
What's inside VAS?
VAS, is the set of ranges of virtual addresses available to a process, so what is inside a VAS? A typical memory representation of process consists of following sections:
Stack:
VAS section that is used for several related purposes, the main one being to keep track of the point to which each active subroutine should return control when it finishes executing. The return address is pushed onto the stack by the caller. When it finishes, the called subroutine, pops the return address off the stack and transfers control to that address.
That section also stores temporary variables created by each function inside the program. The stack is a LIFO data structure, managed and optimized by the CPU quite closely. Every time a function declares a new variable, it is "pushed" onto the stack, you don't have to allocate the needed memory by hand. Then every time a function exits, all of the variables pushed onto the stack by that function, are freed for you. Once a stack variable is freed, that region of memory becomes available for other stack variables.Heap:
VAS section where dynamic memory allocation usually takes place. Unlike the Stack, this part of the VAS is not managed automatically for you, and is not as tightly managed by the CPU. You are in charge of allocating memory on the heap. You are also responsible for deallocating that memory once you don't need it any more. If you fail to do this, your program will have what is known as a memory leak.Initialized Data Segment:
Or simply, Data Segment. VAS section, which contains the global and static variables that are initialized by the programmer. The size of this segment is determined by the size of the values in the program's source code, and does not change at run time.Uninitialized (bss) Data Segment:
VAS section that contains all global and static variables that are initialized to zero or do not have explicit initialization in the programer's source code.Text (code) Segment:
VAS section that contains machine instructions of the program. Those machine instructions can be thought of as the text of a novel: It tells the story of what the program does.
How to do some introspection?
How do we learn about the memory layout of a running process? How do we look at how program are laid out in memory?
- Directly from /proc/PID/maps:
You can directly ask to the process information pseudo-filesystem: proc. Let's see the output ofcat /proc/6026/maps. Here6026is the PID of a running process on my Debian:
00400000-00401000 r-xp 00000000 08:05 3181468            /home/nsukami/bin/how_to_vms
00600000-00601000 rw-p 00000000 08:05 3181468            /home/nsukami/bin/how_to_vms
01698000-016b9000 rw-p 00000000 00:00 0                  [heap]
7f747118a000-7f747132c000 r-xp 00000000 08:01 131521     /lib/x86_64-linux-gnu/libc-2.19.so
7f747132c000-7f747152b000 ---p 001a2000 08:01 131521     /lib/x86_64-linux-gnu/libc-2.19.so
7f747152b000-7f747152f000 r--p 001a1000 08:01 131521     /lib/x86_64-linux-gnu/libc-2.19.so
7f747152f000-7f7471531000 rw-p 001a5000 08:01 131521     /lib/x86_64-linux-gnu/libc-2.19.so
7f7471531000-7f7471535000 rw-p 00000000 00:00 0
7f7471535000-7f7471555000 r-xp 00000000 08:01 130924     /lib/x86_64-linux-gnu/ld-2.19.so
7f7471734000-7f7471737000 rw-p 00000000 00:00 0
7f7471752000-7f7471755000 rw-p 00000000 00:00 0
7f7471755000-7f7471756000 r--p 00020000 08:01 130924     /lib/x86_64-linux-gnu/ld-2.19.so
7f7471756000-7f7471757000 rw-p 00021000 08:01 130924     /lib/x86_64-linux-gnu/ld-2.19.so
7f7471757000-7f7471758000 rw-p 00000000 00:00 0
7ffc4d89b000-7ffc4d8bc000 rw-p 00000000 00:00 0          [stack]
7ffc4d99b000-7ffc4d99d000 r-xp 00000000 00:00 0          [vdso]
7ffc4d99d000-7ffc4d99f000 r--p 00000000 00:00 0          [vvar]
ffffffffff600000-ffffffffff601000 r-xp 00000000 00:00 0  [vsyscall]
The Heap segment and the Stack segment are labelled, easy. The addresses are displayed from the lowest `00400000`, to the highest `ffffffffff601000`. The first segment, `00400000-00401000`, is read-only and executable, so, this is the Code segment. We know that between the Code segment, and the Heap segment, there is the Data segment. If you don't want to browse the `/proc` directory, there is also the [pmap](http://linux.die.net/man/1/pmap) command you can use to report the memory map of a process.
- Using the GNU debugger: GDB, the awesome GNU Project debugger, allows you, among others things, to see what is going on
insidea running process. For example, from the gdb prompt, you can typeinfo proc mappingsto see the current address mapping:
process 8460
Mapped address spaces:

        Start Addr           End Addr     Size   Offset objfile
          0x400000           0x401000   0x1000      0x0 /home/nsukami/bin/how_to_vms
          0x600000           0x601000   0x1000      0x0 /home/nsukami/bin/how_to_vms
          0x601000           0x622000  0x21000      0x0 [heap]
    0x7ffff7a31000     0x7ffff7bd3000 0x1a2000      0x0 /lib/x86_64-linux-gnu/libc-2.19.so
    0x7ffff7bd3000     0x7ffff7dd2000 0x1ff000 0x1a2000 /lib/x86_64-linux-gnu/libc-2.19.so
    0x7ffff7dd2000     0x7ffff7dd6000   0x4000 0x1a1000 /lib/x86_64-linux-gnu/libc-2.19.so
    0x7ffff7dd6000     0x7ffff7dd8000   0x2000 0x1a5000 /lib/x86_64-linux-gnu/libc-2.19.so
    0x7ffff7dd8000     0x7ffff7ddc000   0x4000      0x0
    0x7ffff7ddc000     0x7ffff7dfc000  0x20000      0x0 /lib/x86_64-linux-gnu/ld-2.19.so
    0x7ffff7fd7000     0x7ffff7fda000   0x3000      0x0
    0x7ffff7ff5000     0x7ffff7ff8000   0x3000      0x0
    0x7ffff7ff8000     0x7ffff7ffa000   0x2000      0x0 [vdso]
    0x7ffff7ffa000     0x7ffff7ffc000   0x2000      0x0 [vvar]
    0x7ffff7ffc000     0x7ffff7ffd000   0x1000  0x20000 /lib/x86_64-linux-gnu/ld-2.19.so
    0x7ffff7ffd000     0x7ffff7ffe000   0x1000  0x21000 /lib/x86_64-linux-gnu/ld-2.19.so
    0x7ffff7ffe000     0x7ffff7fff000   0x1000      0x0
    0x7ffffffde000     0x7ffffffff000  0x21000      0x0 [stack]
0xffffffffff600000 0xffffffffff601000   0x1000      0x0 [vsyscall]
And there is more to explore:
(gdb) help info proc
Show /proc process information about any running process.
Specify any process id, or use the program being debugged by default.

List of info proc subcommands:

info proc all -- List all available /proc info
info proc cmdline -- List command line arguments of the process
info proc cwd -- List current working directory of the process
info proc exe -- List absolute filename for executable of the process
info proc mappings -- List of mapped memory regions
info proc stat -- List process info from /proc/PID/stat
info proc status -- List process info from /proc/PID/status

Type "help info proc" followed by info proc subcommand name for full documentation.
Type "apropos word" to search for commands related to "word".
Command name abbreviations are allowed if unambiguous.
(gdb)
How to create a process?
1.fork(): The fork() system call is used to create processes. It takes no arguments and returns a process ID. The purpose of fork() is to create a new process, which becomes the child process of the caller:
#include <stdio.h>
#include <sys/types.h>
#include <unistd.h>
#include <stdlib.h>
#include <sys/wait.h>
#include <string.h>

void execute();

int main() {
  execute();
  return 0;
}

void execute() {
  int pid, status;

  if((pid = fork()) == 0){
    char *cmd[5] = {"ls", "-a", "-l", "-h", '\0'};

    if (execvp(*cmd, cmd) < 0){
      printf("*** ERROR: exec failed\n");
      perror(*cmd);
      exit(1);
    }
  }else{
    printf("*** ERROR: forking child process failed\n");
    perror("fork");
    exit(EXIT_FAILURE);
  }

  //The parent executes the wait.
  while (wait(&status) != pid){}
}
I really would like to write more on this topic. Maybe in another post, otherwise the article will be too long, and I have the dishes to do. At least, we've seen that there is an interesting amount of informations behind what is called a process.